Menu Sport Bar: Design a Profitable Game-Day Menu
Published on
By Tony Newcome — Founder of AnchOps · Owner, Pizza Harbour
This article was drafted with AI assistance and reviewed by Tony Newcome, a working restaurant operator.
A profitable sports bar menu is built as one system: every item needs a reason to exist, a station that can execute it during a three-game Sunday, a price based on cost and contribution, and a visible labor requirement. Design the sections, price for margin with food and pour cost, apply menu engineering, and map every item to a station.
That problem rarely begins with the recipe. It begins when the menu, kitchen capacity, pricing model, and labor plan are built separately. A profitable menu sport bar operation closes that loop. Every item should have a reason to exist, a station that can execute it, a price based on its cost and contribution, and a staffing requirement visible in POS data.
Table of Contents
- Why Most Sports Bar Menus Leak Profit Before Service Even Starts
- Define the Sections and Signature Items of a Sports Bar Menu
- A sample game-day structure
- Price for Margin with Food Cost, Pour Cost, and Contribution
- Three costed examples
- Apply Menu Engineering to Promote the Right Items
- What each quadrant demands
- Map Every Item to a Station and Prep Time
- A practical station map
- Forecast Labor per Item and per Shift Using Sales Data
- A worked shift model
- Where forecasts go wrong
- Connect the Menu to POS Data and Scheduling Software
- Why the same revenue can need different labor
Why Do Most Sports Bar Menus Leak Profit Before Service Even Starts?
The Sunday rush exposes weaknesses that stay hidden on quieter shifts. A broad menu may look generous to guests, but each additional sauce, garnish, protein, side, and preparation method creates more prep, more storage, more training, and more opportunities for waste. Popular items can bleed margin when portion control is loose or when several menu categories depend on the same overloaded station.
The U.S. sports-bars industry reached an estimated $2.2 billion market size in 2024, with a reported 2.3% CAGR from 2019 to 2024. The same industry source counted 1,548 businesses and reported a 4.7% CAGR in business count over that period, showing that sports bars are a substantial restaurant segment rather than a narrow nightlife niche (IBISWorld sports bars industry data).
The four leaks I see most often are structural:
- Too many SKUs: The kitchen carries ingredients that sell slowly and complicate every rush.
- No station ownership: Menu items aren't assigned to the fryer, grill, cold line, or bar in a way that reveals capacity.
- Competitor-led pricing: Prices reflect nearby menus instead of costed recipes and contribution.
- Template scheduling: Managers repeat last week's staffing pattern even when the event, sales mix, and menu demand have changed.
Operator rule: A popular item that slows the line, requires unique prep, and contributes little after labor isn't an anchor. It's a liability with good marketing.
Loaded nachos, elaborate wing flights, and heavily customized burgers often look like signature products. They can also consume several stations at once, especially when toppings require cold-line finishing and proteins require separate cooking. A tighter menu wins on game days because it gives the kitchen fewer decisions, fewer handoffs, and more predictable production.
The work starts before printing. Build the sections around the events you serve, cost each item, map every item to a station, and use the resulting sales mix to forecast labor. That approach turns the menu from a list of choices into an operating plan.
What Sections and Signature Items Belong on a Sports Bar Menu?
A strong sports-bar menu follows guest behavior rather than forcing every item into a broad cuisine category. Pre-game guests want food that arrives quickly and can be shared. In-game orders favor handhelds, wings, fries, and drinks that can be eaten without losing sight of the screen. Post-game traffic needs late-night items that use existing prep instead of opening a second kitchen.
For a 3,000 sq ft box, I'd start with 28 to 36 total SKUs. The exact count depends on equipment and staffing, but the discipline matters. Each section needs one recognizable anchor, supported by items that share ingredients and station work.
A workable structure looks like this:
- Sharable starters: Dips, nachos, fries, and one hot specialty.
- Handhelds: Burgers, sliders, sandwiches, and a vegetarian handheld.
- Wings and tenders: One signature wing style, a controlled sauce set, and tenders.
- Pizza or flatbreads: Products that share dough, cheese, and a predictable oven process.
- Group platters: Bundles designed for tables watching a full game.
- Desserts: A short list with minimal finishing.
- Bar bites: Smaller portions for late-night and drink-led orders.
Use one or two limited-time offers tied to the sports calendar, such as a March Madness shareable or an NFL kickoff platter. Don't let the LTO require a new protein, a new cooking method, and a new garnish. It should feel new to the guest while remaining familiar to the line.
A sample game-day structure
The following 32-item menu keeps the sections distinct while concentrating work on repeatable stations.
| Section | SKU Count | Signature Anchor | Strongest Daypart |
|---|---|---|---|
| Sharable starters | 6 | Loaded game-day nachos | In-game |
| Handhelds | 6 | Signature smash burger | Pre-game |
| Wings and tenders | 5 | Smoked-and-tossed wings | In-game |
| Pizza or flatbreads | 4 | Buffalo chicken flatbread | In-game |
| Group platters | 4 | Game-day mixed platter | In-game |
| Desserts | 3 | Warm cookie skillet | Post-game |
| Bar bites | 4 | Crispy tenders and fries | Post-game |
A resource such as design a bar bistro menu can help with the guest-facing organization, but the operator's test is execution. If an item can't share prep, equipment, or plating components with the rest of the section, it needs a strong financial reason to stay.
Price for Margin with Food Cost, Pour Cost, and Contribution
Pricing starts with a costed recipe, not a competitor's menu. For food, a practical target may sit around 28% to 32% food cost. For drinks, a useful pour-cost range is 18% to 22%, but those targets only matter when the recipe, portion, waste, and actual sales price are accurate.
The core formulas are straightforward:
- Selling price = recipe cost ÷ target food cost
- Contribution margin = selling price minus recipe cost minus variable labor
The second formula is the one that pays rent, labor, and operating expenses. A low food-cost percentage can still produce a weak item if the product takes too long to prep, cook, or finish.
Three costed examples
| Item | Recipe Cost | Target Cost % | Selling Price | Contribution Margin |
|---|---|---|---|---|
| Bone-in wings | $1.18 | 30% | $3.93 | $2.75 before variable labor |
| 8 oz smash burger | $2.40 | 32% | $7.50 | $5.10 before variable labor |
| 16 oz draft cocktail | $0.94 | 20% | $4.70 | $3.76 before variable labor |
The prices above are mathematical outputs, not necessarily finished menu prices. A wing price of $3.93 may need to be rounded for guest readability, and the final price should account for actual portion size, packaging, discounts, and labor minutes. If the wing price moves by $1 and the item sells at enough volume, the weekly contribution change can be significant. The supplied operator example puts that change at more than $1,800 in a typical sports bar, so the exact sales count and time period must be validated against your POS before applying it.
Beverage profitability also depends on inventory control. Consistent jiggers, measured batching, draft yield checks, and documented comp rules matter as much as the listed price. Operators reviewing bar controls can use this practical resource on cut bar shrinkage with ROCKS, then connect those controls to the drink recipes in an internal bar drinks menu.
Before an item gets printed, check:
- Recipe cost: Does the cost include sauce, garnish, oil, side, and waste?
- Labor minutes: How much station time does the item consume?
- Equipment demand: Does it compete with a higher-contribution item during a rush?
- Price integrity: Does the price meet the target without hiding an unprofitable portion?
- Discount exposure: Does a bundle or promotion erase the contribution?
- Sales role: Is the item an anchor, a traffic builder, or a profitable add-on?
Apply Menu Engineering to Promote the Right Items
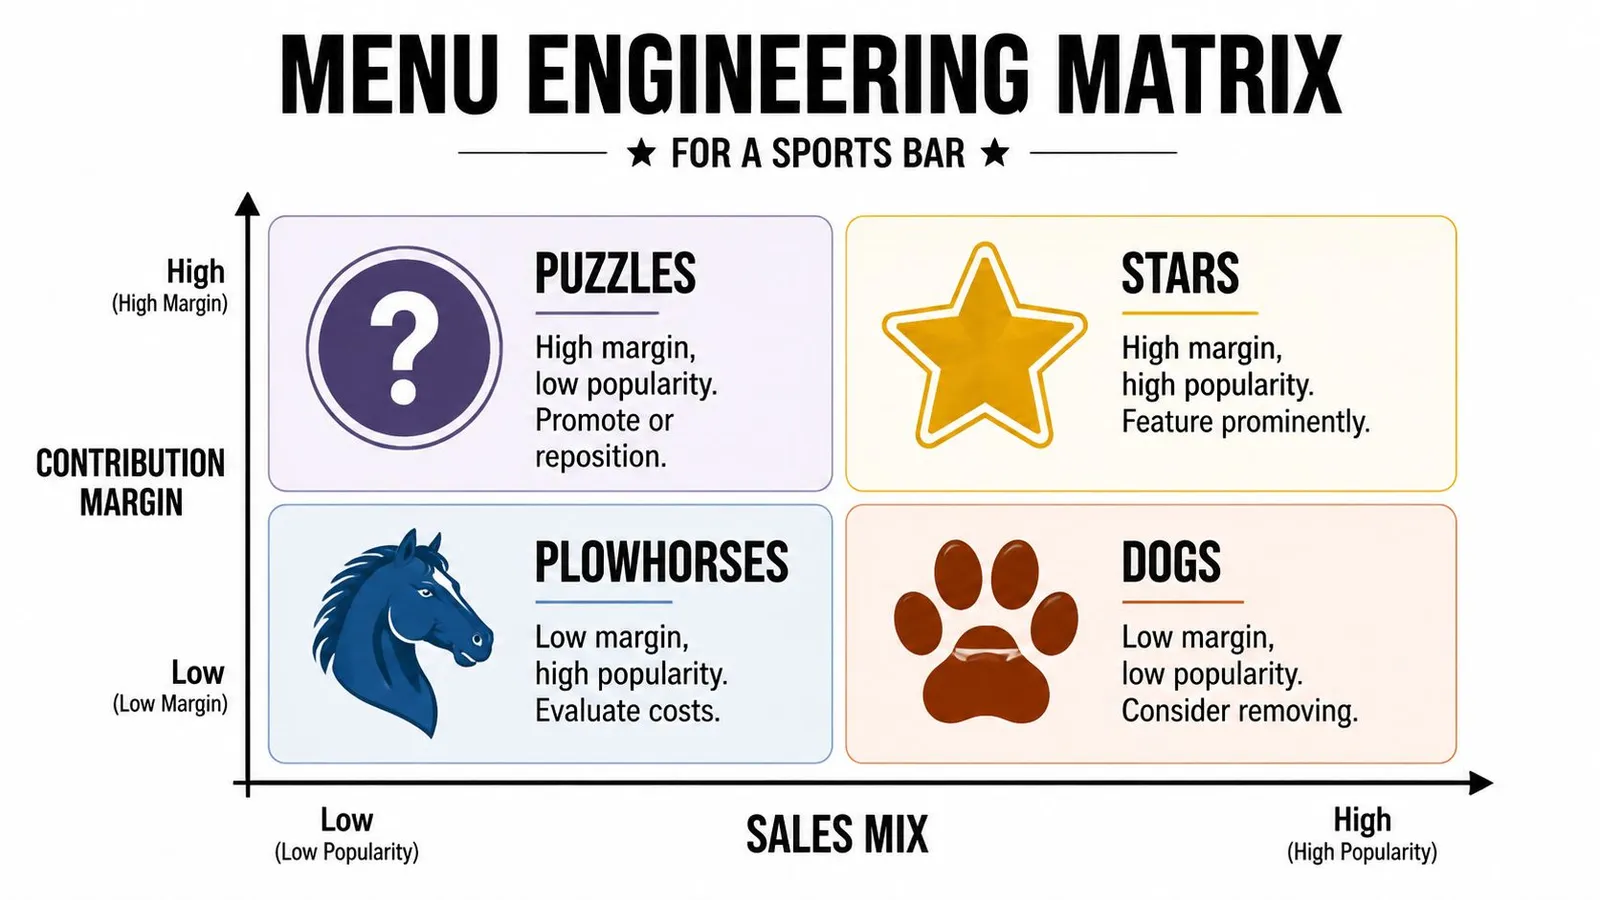
Menu engineering works when it uses current POS behavior rather than intuition. Pull 30 days of sales mix and contribution margin by item, then classify each product as a Star, Plowhorse, Puzzle, or Dog. The classification gives the menu a job beyond describing food.
The popularity threshold can be set around the top 70% of sales mix for the chosen analysis. Draw the popularity and contribution lines in a spreadsheet, then place every appetizer, entrée, cocktail, beer bucket, and dessert into a quadrant.
What each quadrant demands
Stars combine high popularity with high contribution. Put them in the strongest visual positions, such as an eye-level menu box, a server recommendation, or the chalkboard above the bar. Protect their availability, because running out of a Star during a major event sends demand toward less profitable substitutes.
Plowhorses sell well but contribute less. Loaded nachos often land here. Don't remove them automatically. Re-cost the portion, tighten toppings, adjust the price, or turn the item into a game-day combo that adds a profitable drink or side.
Puzzles contribute well but sell slowly. Boneless wings may become a Puzzle when guests prefer bone-in wings or when the description fails to communicate the value. Retrain servers, improve the name or photograph, and test placement before cutting the item.
Dogs have weak popularity and weak contribution. A Dog that also requires unique prep should usually be removed. If it has a strategic role, simplify it until it shares ingredients and equipment with a stronger seller.
Practical test: Don't promote a Puzzle just because its margin looks attractive. First ask whether the kitchen can execute the added demand without displacing a Star.
The matrix should lead to action, not decoration. Review the categories after a defined operating period, record the change in sales mix and contribution, and keep the menu language aligned with what the kitchen can deliver.
Map Every Item to a Station and Prep Time
Ticket time becomes manageable when every item has an owner. Build a station map that records the equipment, mise en place, cook time, finishing steps, and handoffs. Without that map, the menu hides labor in vague descriptions such as “crispy,” “smoked,” or “loaded.”
A typical sports-bar line may divide into four operating areas:
- Fry station: Wings, tenders, mozzarella sticks, fries, and fried shareables.
- Flat-top or grill: Burgers, grilled sandwiches, steak items, and hot platter proteins.
- Cold station: Salads, slaws, toppings, sauces, garnish, and final assembly.
- Bar station: Cocktails, draft pours, beer buckets, mocktails, and drink garnishes.
Prep time includes portioning wings, marinating proteins, batching sauces, cutting vegetables, and staging containers. Cook time begins when the item enters the fryer, grill, oven, or other active equipment. Keep the two measures separate because prep labor occurs before the rush, while cook time consumes peak capacity.
A practical station map
| Menu Item | Station | Prep Time (min) | Cook Time (min) | Total Ticket Time |
|---|---|---|---|---|
| Smoked-and-tossed wings | Fry | 4 | 8 | 12 |
| Smash burger | Flat-top and cold | 3 | 7 | 10 |
| Hand-battered tenders | Fry | 4 | 7 | 11 |
| Loaded nachos | Cold and oven | 5 | 6 | 11 |
| Buffalo chicken flatbread | Oven and cold | 4 | 7 | 11 |
| Draft cocktail | Bar | 2 | 2 | 4 |
These times are operating targets for the example map, not universal facts. Measure them during real service, because a fryer basket shared by wings, tenders, and appetizers behaves differently from a dedicated fryer.
The fryer is often the bottleneck when orders arrive in waves, especially during short halftime windows. If an item regularly exceeds a 12-minute game-day ticket-time ceiling, change the description, move the prep upstream, redesign the garnish, or remove the item. A profitable item that arrives late still creates refunds, remakes, and table frustration.
How Do You Forecast Labor per Item and per Shift?
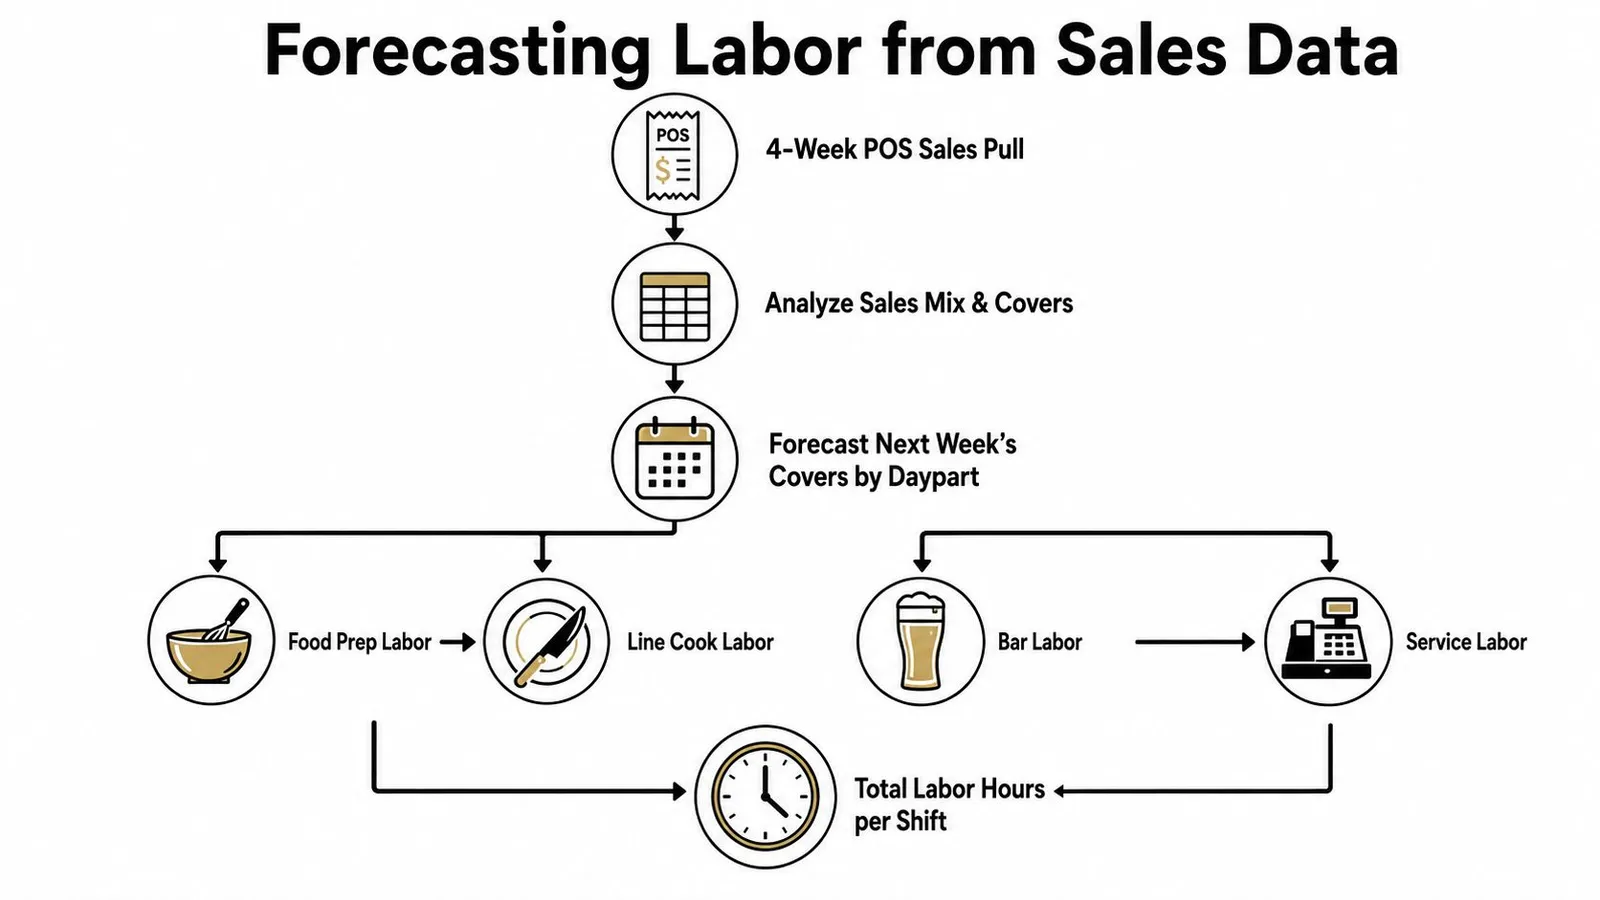
A labor plan should begin with expected sales, not a copied schedule. Pull four weeks of POS history from Toast or a comparable system, separate dayparts and event types, and forecast the next Sunday by hour. Then translate the expected item mix into station minutes.
The calculation is:
Forecasted item count × labor minutes per item ÷ 60 = labor hours per station
If the POS expects more wings, the plan needs more fry capacity and prep support. If it expects beer buckets, bartender labor may rise while kitchen labor stays flat. The sales mix tells you which kind of labor is needed, not just how many guests may arrive.
A worked shift model
For a Sunday with 280 covers and a 60% food, 40% beverage mix, the worked operating example produces:
- 9.2 kitchen hours
- 6.1 bar hours
- 11.4 front-of-house hours
Those hours should be distributed by daypart and station rather than placed on the schedule as a single block. Prep cooks may start before doors open, line cooks may overlap during the event peak, and bartenders may need reinforcement around order surges rather than throughout the entire shift.
The planning benchmark in the supplied model targets 24% to 28% labor-to-sales for full-service sports bars and 18% to 22% for counter-service concepts. Treat those as planning ranges, not universal rules. Broader restaurant guidance commonly places labor near 25% to 35% of sales, while the National Restaurant Association's 2025 operations data abstract reported a 36.5% median full-service labor cost across more than 900 restaurants (National Restaurant Association operations data summary). A concept operating near that median shouldn't force a lower target without checking ticket times, coverage, and employee workload.
Where forecasts go wrong
- Old comparisons: Last year's event may not resemble last month's guest behavior, pricing, or roster.
- Halftime blindness: Hourly averages hide short bursts that overwhelm the fryer and bar.
- Mix omission: Beer buckets can add bartender work without adding equivalent kitchen tickets.
- Static templates: A Tuesday burger shift and a Sunday wings shift need different station coverage.
- No mid-shift check: If actual sales outrun the forecast, managers need a way to adjust before labor drifts.
Restaurants using demand-based scheduling commonly forecast covers or sales by hour, set labor targets, and assign roles against those targets. Publishing schedules 10 to 14 days in advance with managed swaps can improve planning, provided managers still enforce breaks, overtime, minor, and clopening rules (restaurant scheduling templates and planning guidance).
The sales forecast should remain visible during service. Compare projected and actual sales, ticket volume, and station load, then cut or redeploy coverage when the rush passes.
For operators building the labor model, sales forecasting for restaurants provides a useful framework for connecting historical sales to upcoming staffing decisions.
Connect the Menu to POS Data and Scheduling Software
The closed loop is simple to describe. The menu creates the demand categories, the POS records what guests buy, and the scheduler turns that demand into staffed hours. The difficult part is keeping the category names, event tags, station assignments, and labor roles consistent.
Start by exporting three Toast views:
| Menu Category | Toast Report Source | AnchOps Labor Category | Forecast Driver |
|---|---|---|---|
| Wings and tenders | Item Sales by Daypart | Fry and prep | Item count by event hour |
| Burgers and handhelds | Item Sales by Daypart | Grill and cold line | Covers plus item mix |
| Cocktails | Mod Mix | Bar | Cocktail count and complexity |
| Shareables | Event Tag performance | Fry, oven, and expo | Event demand and party size |
| Beer buckets | Mod Mix and Event Tag performance | Bar and service | Bucket count by game window |
The report names above give managers a repeatable pull list. Item Sales by Daypart reveals when specific products sell. Mod Mix shows the customizations that create extra prep or finishing work. Event Tag performance separates an NFL Sunday from a routine Tuesday, which prevents the schedule from treating unlike shifts as interchangeable.
Map each menu category to a station and labor category inside AnchOps or a comparable scheduling tool. The forecast should use expected covers, average ticket, item-level mix, prep minutes, cook minutes, and bar complexity. A Toast-connected scheduling platform can pull sales data into projected labor costs while managers build schedules, allow employees to request swaps for approval, and transfer tip data into pooling rules based on hours worked or percentage splits (Toast scheduling software integration guidance).
Why the same revenue can need different labor
A 220-cover NFL Sunday with 22% of food sales in wings and 18% of beverage sales in cocktails creates a different plan from a 90-cover Tuesday built around burgers and beer, even if the revenue is the same. The first shift puts pressure on the fryer, bar, garnish prep, and expo. The second concentrates work on the flat-top and may need less cocktail support.
That difference is why the menu should be the input and POS data the verification. Every schedule edit should answer a practical question: did the menu change, did the event mix change, did the station timing change, or did actual demand move away from the forecast?
A shift swap policy should require requests through one approved channel, confirm that the replacement is qualified, and block swaps that create overtime or violate hour limits without approval. If the manager hasn't approved the swap in the scheduling system, the originally scheduled employee remains responsible for the shift (restaurant attendance and shift-swap guidance).
For broader software criteria, this guide to top restaurant management software helps frame the difference between a basic roster tool and a system that connects scheduling, timekeeping, labor projections, and POS workflows. AnchOps offers automated schedule drafts, coverage outreach, timecards, labor projections, mid-shift alerts, reliability tracking, and Toast-based tip-pool calculations for shift-based restaurant teams.
AnchOps connects your sports-bar menu data to scheduling, coverage, timecards, labor projections, and Toast-based tip workflows, so managers can build staffing around the items and events driving service. Visit AnchOps to see how the platform can help turn your game-day menu into a more accurate labor plan.
Your back-of-house partner is ready
AnchOps handles scheduling, tip calculations, labor costs, and timecards — so you can focus on your restaurant, not your paperwork.