How to Use Historical Sales Data for Scheduling
Published on
By Tony Newcome — Founder of AnchOps · Owner, Pizza Harbour
This article was drafted with AI assistance and reviewed by Tony Newcome, a working restaurant operator.
To use historical sales data for scheduling, break daily totals into daypart-level patterns, filter out broken baselines like promotions and one-off events, translate the sales forecast into labor needs by role, and close the loop with a POS integration so the data flows automatically. Memory-based scheduling fails because totals hide when the pressure actually hit.
That's the operational reality of historical sales data. Used properly, it replaces memory with a repeatable staffing baseline. Used carelessly, it turns bad assumptions into a polished schedule that still leaves the floor short-handed or the labor budget bloated.
Table of Contents
- Why Gut Feelings Fail at Shift Scheduling
- Defining Actionable Historical Sales Data
- Start with the fields that affect coverage
- Use time buckets that match the floor
- When Historical Baselines Break Down
- Audit comparability before calculating an average
- Weight the current operation more heavily
- Translating Sales History into Labor Forecasts
- Build the forecast in five passes
- Treat the forecast as a live operating plan
- Closing the Loop with POS Integration
- Use actuals before the shift is over
- Automate calculations that invite disputes
- Choosing the Right Forecasting Complexity
- Forecasting methods compared
- Choose based on the decision
- Building a Reliable Scheduling Foundation
Why Gut Feelings Fail at Shift Scheduling
A manager builds a rota from fragments. Last Tuesday, one employee called out. The week before, rain kept customers away. A holiday changed the lunch pattern, and a local event filled the dining room later than expected. By Monday, those separate memories have blended into one vague conclusion: “Tuesday usually needs three servers.”
That conclusion may be wrong in both directions. If the shift starts overstaffed, labor costs rise while employees stand around waiting for tables. If it starts understaffed, ticket times stretch, sections become unmanageable, and the team spends the night apologizing for a forecast nobody formally made.
Practical rule: Don't schedule against what last week's rota looked like. Schedule against the demand that rota was supposed to serve.
Last week's schedule is an input, not proof. It reflects availability, call-offs, manager preferences, and whoever happened to be working. It may also reflect a bad decision that you're about to repeat. A sales record, by contrast, can show the demand pattern that occurred, provided you examine it at a useful level.
The broader market gives operators context. U.S. retail and food services sales reached $773.9 billion in August 2026, up 1.2% from the previous month and 6.0% from August 2025, according to the U.S. retail sales series. Those figures matter for understanding the environment, but they won't tell you whether your restaurant needs another line cook at 6 p.m. on Thursday.
Your schedule needs a smaller lens. Start with actual transactions, covers, service periods, labor worked, and operating conditions at your location. Then ask whether the pattern repeats often enough to guide a shift.
A practical weekly routine looks like this:
- Review demand: Compare relevant historical periods, not just the immediately preceding week.
- Explain exceptions: Mark closures, stockouts, promotions, weather disruptions, and unusual events.
- Set coverage: Convert expected demand into role-specific hours.
- Check reality: Compare the published plan with actual time worked and service pressure.
The payoff isn't perfect prediction. Restaurants rarely get that luxury. The payoff is a schedule that has a visible reason behind it, with clear points for a manager to adjust.
Defining Actionable Historical Sales Data
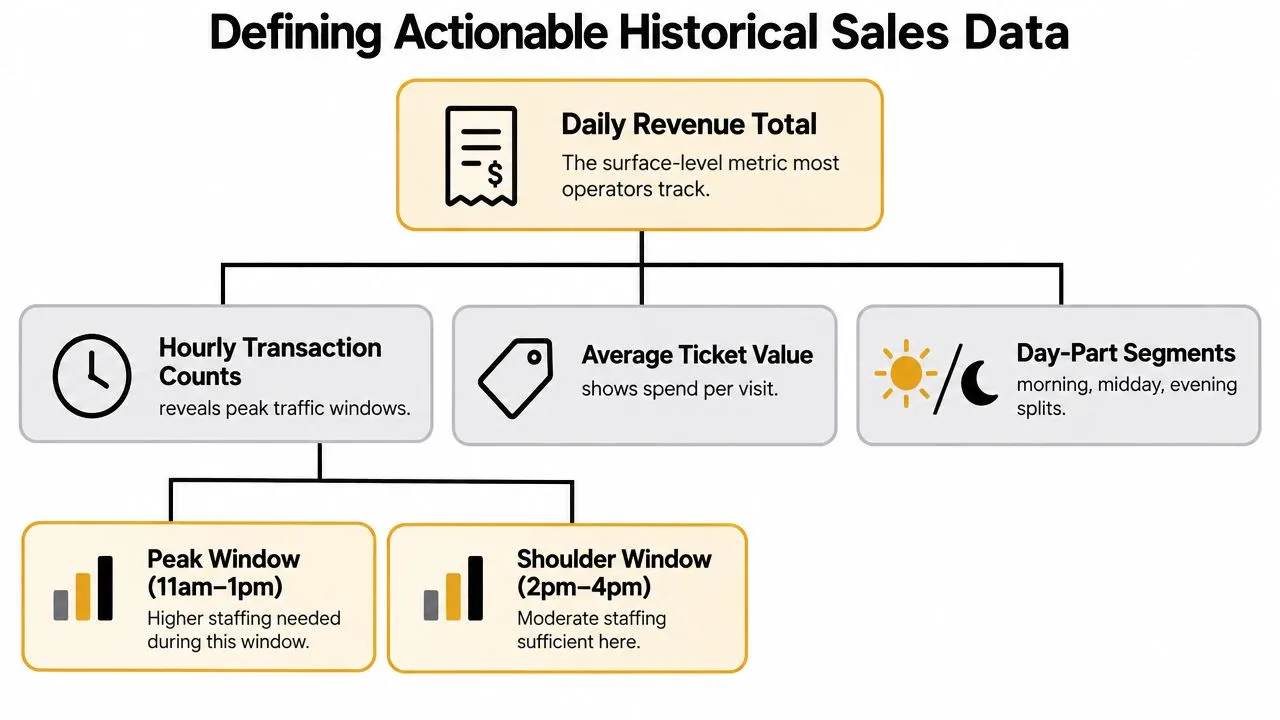
Most operators begin with one figure, daily revenue. It's easy to export and easy to discuss, but it's too coarse for shift planning. A day that produces the same revenue as another day can require a completely different labor pattern if one has a concentrated rush and the other has steady traffic.
Restaurant labor guidance recommends segmenting history by day of week and time bucket, such as shift or day-part, because total sales can hide the peak windows that determine coverage. The same guidance recommends comparing the last 4–8 weeks with the same period last year, then adjusting for holidays, events, and channels, as described in restaurant forecasting guidance from Altametrics.
Start with the fields that affect coverage
A useful POS export should let you separate when demand arrived from how much money it produced. At minimum, organize records by:
- Trading date and weekday: Tuesday lunch shouldn't be blended with Saturday dinner.
- Timestamp or day-part: Group transactions into practical windows such as opening, lunch, afternoon, dinner, and close.
- Transaction count and covers: Revenue alone can rise because customers spend more, without creating equivalent service work.
- Net sales and adjustments: Keep refunds, voids, discounts, and comps visible rather than burying them in one total.
- Channel: Dine-in, takeaway, delivery, catering, and online orders create different labor demands.
- Role and labor record: Compare demand against server, kitchen, bar, host, and support hours.
The key distinction is between sales dollars and workload. A high average ticket may generate strong revenue with relatively modest guest volume. A lower-ticket period may keep the kitchen and front of house busy because many orders arrive close together.
Use time buckets that match the floor
Don't choose segments because the spreadsheet makes them convenient. Choose them because managers make staffing decisions around them. A lunch rush, a late-afternoon shoulder, and a dinner close may need different role coverage even when they belong to the same calendar day.
For each day-part, record projected demand, required roles, scheduled hours, and actual hours. That creates a time series you can inspect for recurring patterns, rather than a pile of daily totals. Forecasting methods that account for seasonality and autocorrelation are useful because sales at one point in time can relate to earlier patterns, as explained in restaurant sales forecasting guidance from Fourth.
National and global figures help frame the market, but they don't replace local history. Worldwide retail sales have been estimated at about $28.2 trillion for 2026, while another review put global retail trade at $30.6 trillion at the end of 2024, up 4.37% from $29.3 trillion the previous year, according to global retail market data from Statista. Those totals establish scale. Your schedule still depends on what happened in your dining room, kitchen, drive-through, or order queue during each relevant window.
When Historical Baselines Break Down
Older data isn't automatically better data. A prior-year comparison can look disciplined while describing a business that no longer exists.
A menu overhaul changes preparation time, item popularity, and the number of stations involved. A price increase changes ticket value without necessarily changing covers. New delivery volume can shift work away from the dining room while adding packaging, expo, and dispatch tasks. Changed opening hours can make a formerly comparable day-part meaningless.
Local conditions can invalidate a baseline just as quickly. Construction can block access. A school schedule can move family traffic. Weather, holidays, events, promotions, and temporary closures can reshape demand. Restaurant forecasting guidance from Altametrics specifically highlights the need to adjust historical sales for these current conditions and business changes.
Audit comparability before calculating an average
Before you average a period, label each record as comparable, adjustable, or unusable.
A comparable record reflects the same operating hours, menu structure, channels, and basic customer context. An adjustable record is still useful after you document a known difference, such as a promotion or a short-term construction problem. An unusable record includes a closure, a major POS failure, or a period when a key service channel was absent from the record.
This classification prevents a common mistake, treating every row as equally trustworthy. It also gives managers a reason to challenge an automated recommendation instead of accepting a clean-looking number.
Weight the current operation more heavily
When conditions have changed, recent comparable history deserves more influence than distant history. Don't discard older records automatically, because they may still reveal weekly or seasonal structure. Use them for context, then let current operating behavior determine the schedule when the old and new patterns conflict.
Look for these warning signs:
- Revenue rises while covers fall: Pricing or product mix may have changed.
- Orders rise without dining-room pressure: A channel shift may be creating different work.
- Labor rises while sales appear stable: Prep, packaging, closing, or inefficiency may be missing from the sales view.
- One period breaks the pattern: Check promotions, weather, events, stockouts, and incomplete imports before treating it as a new normal.
The test is simple: Would I staff this shift the same way if I knew the menu, hours, channels, and local conditions had changed? If the answer is no, the baseline needs adjustment before it reaches the schedule.
Translating Sales History into Labor Forecasts
Clean history becomes useful when it produces a staffing decision. The aim isn't to turn every manager into a statistician. It's to connect expected demand with the roles and hours needed to handle it.
Restaurant scheduling should combine historical covers and sales with confirmed reservations, expected walk-ins, local events, weather, promotions, and prep or closing work outside service hours, according to practical restaurant staff scheduling guidance.
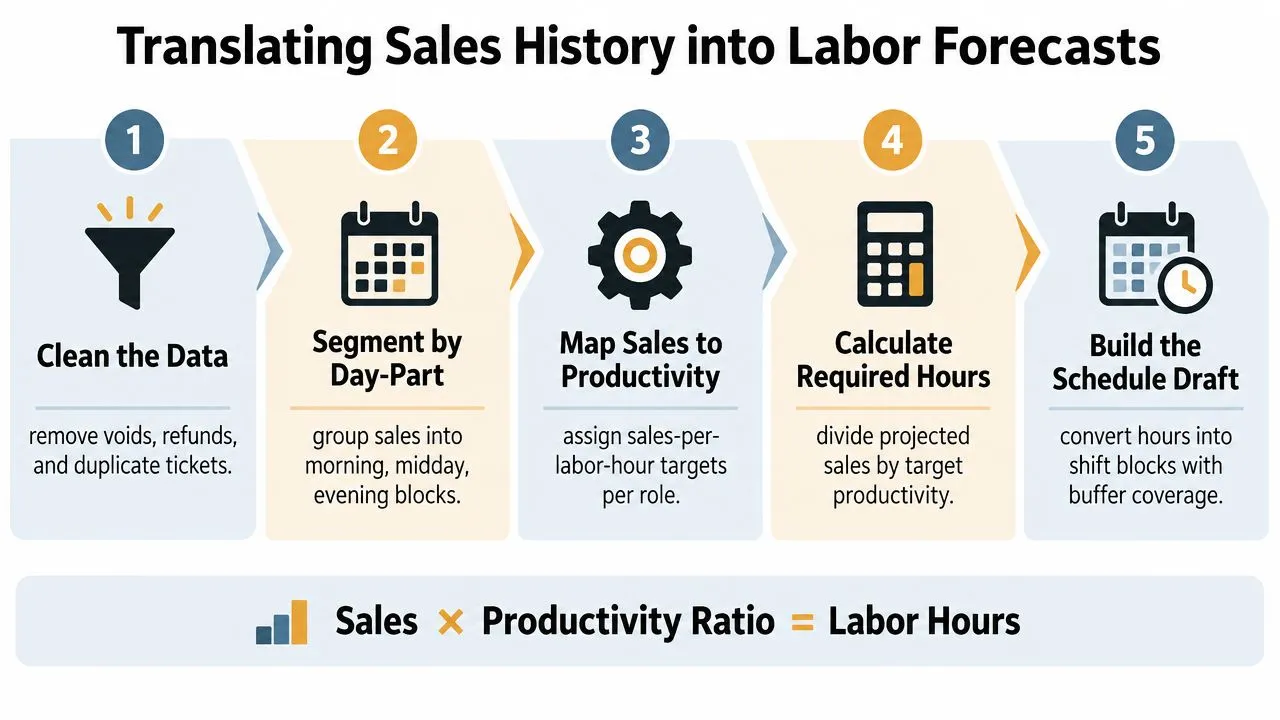
Build the forecast in five passes
Clean the data. Remove duplicate tickets and separate legitimate sales from voids, refunds, and unusual adjustments. Keep an exception log so the same anomaly isn't debated every week.
Segment by day-part. Group comparable demand into operating windows that correspond to shift changes and role coverage. A single daily total can't tell you whether the kitchen needs extra help at opening, during lunch, or at close.
Map demand to productivity. Set role-specific targets using your own operation. A server, prep cook, dishwasher, bartender, and manager don't produce the same kind of work, so one universal sales-to-labor ratio is too blunt.
Calculate required hours. Apply the projected demand to the target for each role, then add work that sales don't capture directly. Prep, receiving, cleaning, opening, closing, and delivery handoff still consume paid time.
Build and review the draft. Convert required hours into shift blocks, protect peak windows, and add coverage for known uncertainty. A scheduling platform can use sales history and availability to produce an autonomous draft, but a manager should still review exceptions before publishing.
Treat the forecast as a live operating plan
A reservation book can make a shift look predictable, while walk-ins and weather can change the result. Use demand signals first, then compare actual sales, covers, and time worked during the shift. If the operation is running above target, the manager should know early enough to redeploy staff, pause extra call-ins, or adjust breaks.
Operators who want a deeper framework for optimizing restaurant staffing with data can use it alongside their POS and labor records. For a more detailed look at the forecasting layer, review this guide to sales forecasting.
The right target is not maximum staffing. It's role coverage matched to the shape of demand, with enough flexibility to handle the conditions your baseline cannot predict.
Closing the Loop with POS Integration
A forecast is only a promise until actual time worked comes back into the system. Without that feedback, managers can't tell whether a labor overage came from an inaccurate demand estimate, a slow service process, extended closing work, or a schedule that placed the wrong roles in the wrong windows.
A closed loop connects four records:
- Projected sales and workload
- Published shifts and role assignments
- Clocked time and actual sales
- Payroll and payout results
That connection changes the manager's question. Instead of asking why labor was high at the end of the pay period, the manager can inspect where the plan diverged during the shift.
Use actuals before the shift is over
Mid-shift visibility matters because some corrections become useless after close. If actual labor is exceeding the target while demand is soft, a manager may shorten an optional extension, move a team member to closing work, or avoid calling in additional coverage. If demand is running ahead, the manager can protect service by keeping qualified staff in place rather than discovering the gap during payroll review.
Workforce-management guidance recommends connecting schedules with sales forecasts, labor data, time and attendance, and payroll. That creates the operational loop of forecasting staffing, publishing shifts, recording time, and reconciling actual labor against the plan, as outlined in restaurant scheduling software guidance from Fourth.
Automate calculations that invite disputes
Tip pools and tip-outs are especially vulnerable to spreadsheet errors because the calculation may depend on sales, hours, roles, and the rules used at the location. POS-integrated tip software can pull sales and labor data from systems such as Toast, Clover, Aloha, and Square to calculate distributions, according to restaurant tip-pooling software guidance from eTip.
That same principle applies to payroll preparation. When approved timecards flow into payroll rather than being retyped, the manager has fewer opportunities to introduce a mismatch between the schedule, the clock, and the pay run. A connected payroll automation workflow also gives operators a cleaner audit trail when an employee questions hours or a labor report looks unusual.
The integration doesn't eliminate judgment. It gives judgment better evidence, closer to the moment when a manager can still act.
Choosing the Right Forecasting Complexity
A small operation with clean records may not need a machine-learning model. A multi-unit group with changing channels, strong seasonality, and scattered data may outgrow a simple average. The right choice depends less on how advanced the software sounds and more on whether the underlying records are reliable enough to support the method.
Time-series approaches model trend, seasonality, and autocorrelation. Same-period comparisons can work well when the operation is stable and the data is segmented consistently. Modern machine-learning approaches may perform better when they include external variables, but they also demand stronger data management and more disciplined validation.
The key trade-off is complexity versus control. A model that managers can understand, inspect, and correct often beats a complex model fed with missing context.
Forecasting methods compared
| Method | Best For | Data Requirements | Complexity |
|---|---|---|---|
| Same-period average | Stable locations with repeatable weekly patterns | Clean sales by comparable weekday and day-part | Low |
| Recent-period comparison | Operations responding to current menu, pricing, or channel changes | Recent segmented history plus exception notes | Low to moderate |
| Seasonal time series | Businesses with recurring calendar patterns and longer history | Consistent time series with identified seasonality and outliers | Moderate |
| ARIMA-style modeling | Teams that need explicit trend, seasonality, and autocorrelation handling | Structured historical series and regular validation | Moderate to high |
| Machine learning with external variables | Volatile operations influenced by weather, events, promotions, and channels | Broad, complete data across sales and relevant conditions | High |
Data quality sets the ceiling. Incomplete, inconsistent, or scattered records can make even a simple report misleading. A current analytics discussion cites a 2025 survey in which 76% of CRM users said less than half of their data was accurate and complete, while 37% said poor data quality caused lost revenue, as reported in sales forecasting methods analysis from ThoughtSpot. Those figures concern CRM data, not restaurant POS records, but the operational lesson transfers: more rows don't help when the context is unreliable.
Choose based on the decision
Use a simple method when managers can explain the result and the business has stable operating conditions. Add time-series methods when recurring patterns are clear but daily noise makes a basic average unstable. Consider machine learning only when you have enough trustworthy context to justify the added maintenance, testing, and oversight.
Financial planning also benefits from matching model sophistication to the decision being made. This overview of decision-driving financial forecasting models is useful for comparing methods without assuming that the most elaborate option is automatically the most practical.
Building a Reliable Scheduling Foundation
Reliable scheduling starts before automation. If the POS export contains missing periods, duplicated tickets, unexplained voids, or no distinction between dine-in and delivery, an automated schedule spreads those errors faster.
The foundation is a disciplined operating cycle: segment demand by day-part, audit whether past periods remain comparable, validate labor targets against actual payroll, and refresh the data regularly. Managers should also record why a shift deviated from plan. A weather disruption, stockout, call-off, or event is useful context when the same weekday comes around again.
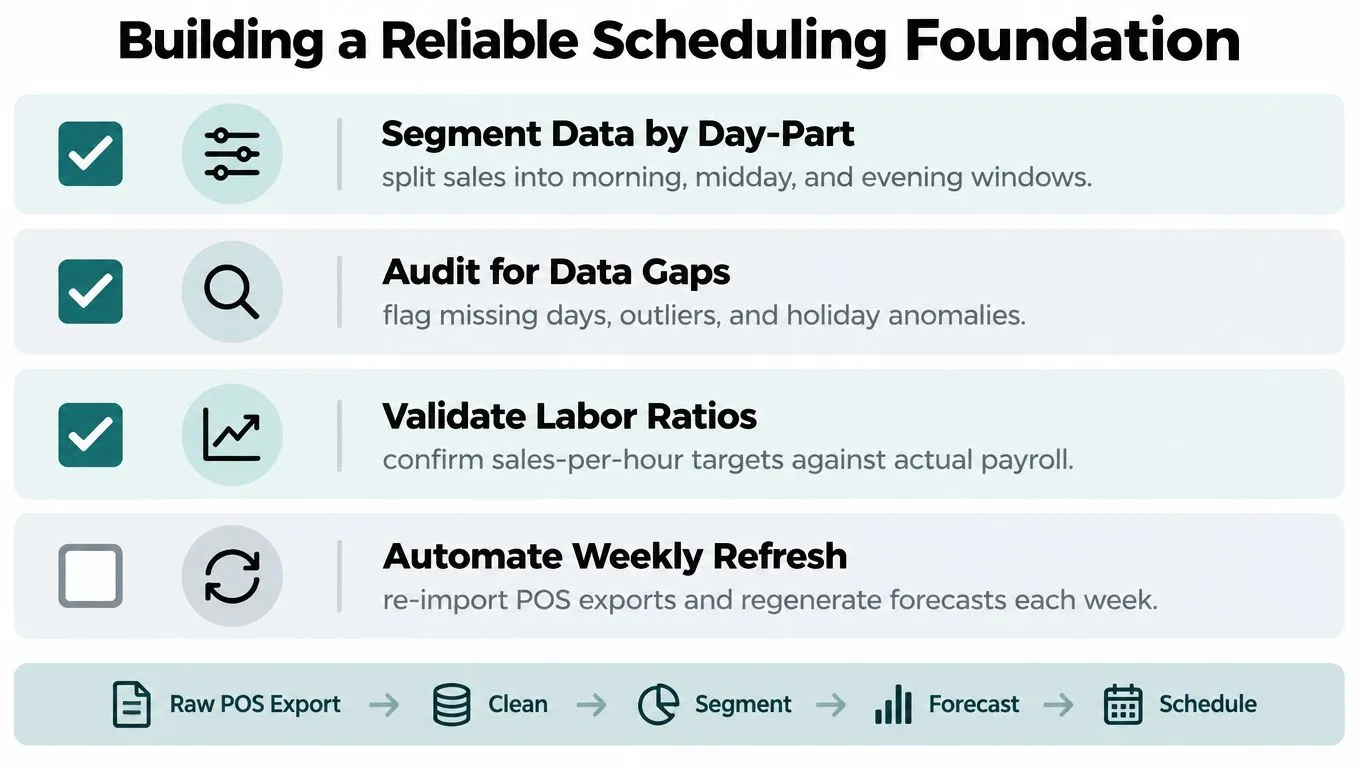
Use this audit before you hand the process to software:
- Segment the record: Can you see demand by weekday, time bucket, channel, and role?
- Flag data gaps: Can you identify missing imports, outliers, stockouts, promotions, closures, and unusual events?
- Validate labor targets: Do projected hours reconcile with actual timecards, payroll, and the work required outside service?
- Refresh the forecast: Does the process re-import current POS data and update assumptions instead of relying on a static template?
A platform such as AnchOps can draft schedules from sales history and employee availability, prioritize proven-reliable staff using rolling performance records, manage timecards, and provide labor projections with mid-shift alerts. The useful labor planning workflow still depends on a clean foundation and a manager who understands the exceptions.
Historical sales data isn't just a rearview mirror. It becomes a labor-control system when operators clean it, segment it, test its relevance, connect it to actual time worked, and use the result to make decisions before the shift gets away from them.
If your schedules still begin with memory and a blank grid, start by exporting recent POS sales and timecards, then mark the periods that aren't comparable. Visit AnchOps to see how sales history, availability, schedule drafting, timekeeping, labor alerts, and POS-linked payout workflows can fit into one operating process.
Your back-of-house partner is ready
AnchOps handles scheduling, tip calculations, labor costs, and timecards — so you can focus on your restaurant, not your paperwork.